Four charts about global CO2 emissions
Our recent live discussion explored how emissions cuts have progressed and might develop, as well as the potential role of SRM. This page collects some of the graphics we produced on past and future emissions.
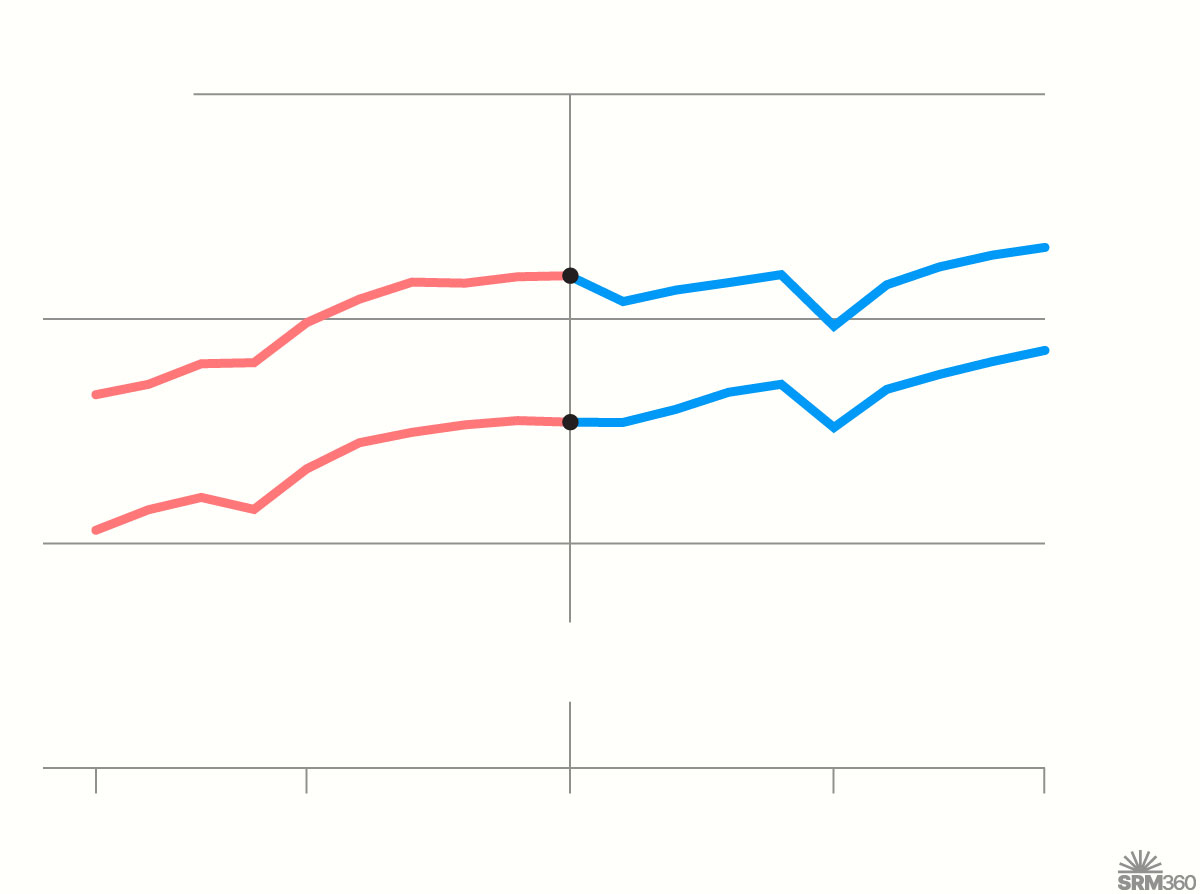
Emissions before and after the Paris Agreement
The adoption of the Paris Agreement in December 2015 was a landmark moment for international climate policy. It introduced the 1.5°C target and requires countries to set goals for reducing emissions, among other measures. How do emissions in the nine years before the Paris Agreement compare to the nine years after?
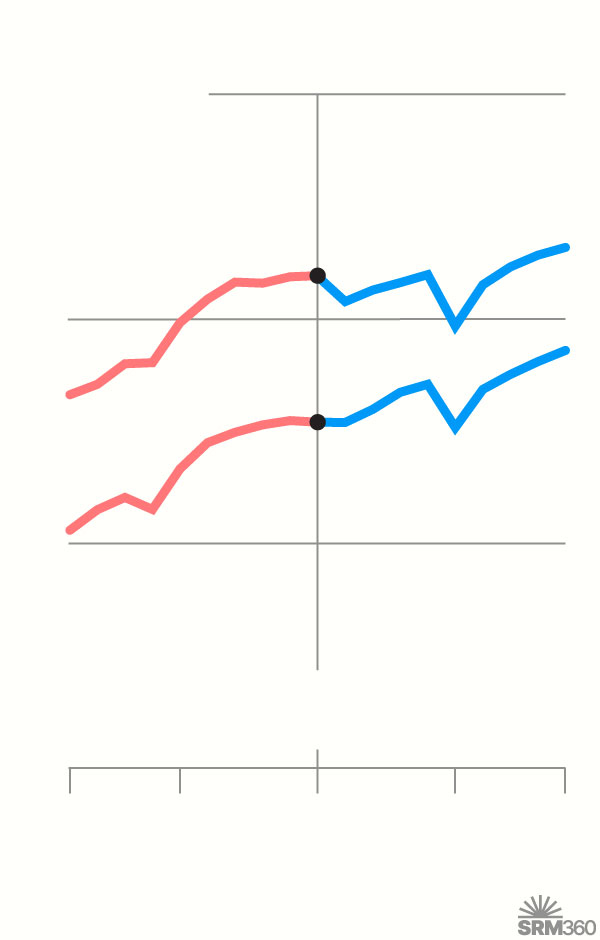
CO₂ emissions
50 billion tonnes
Pre-Paris
Post-Paris
UP 14%
UP 3%
40
UP 9%
Total
UP 16%
30
Fossil fuels
Paris adopted
(2015)
20
’06
’10
’20
’24
Source: Global Carbon Budget (2025) via Our World in Data
CO₂ emissions
50 billion tonnes
Pre-Paris
Post-Paris
UP 14%
UP 3%
Total
40
Fossil fuels
UP 9%
UP 16%
30
Paris adopted
(2015)
20
2006
2010
2020
2024
Source: Global Carbon Budget (2025) via Our World in Data
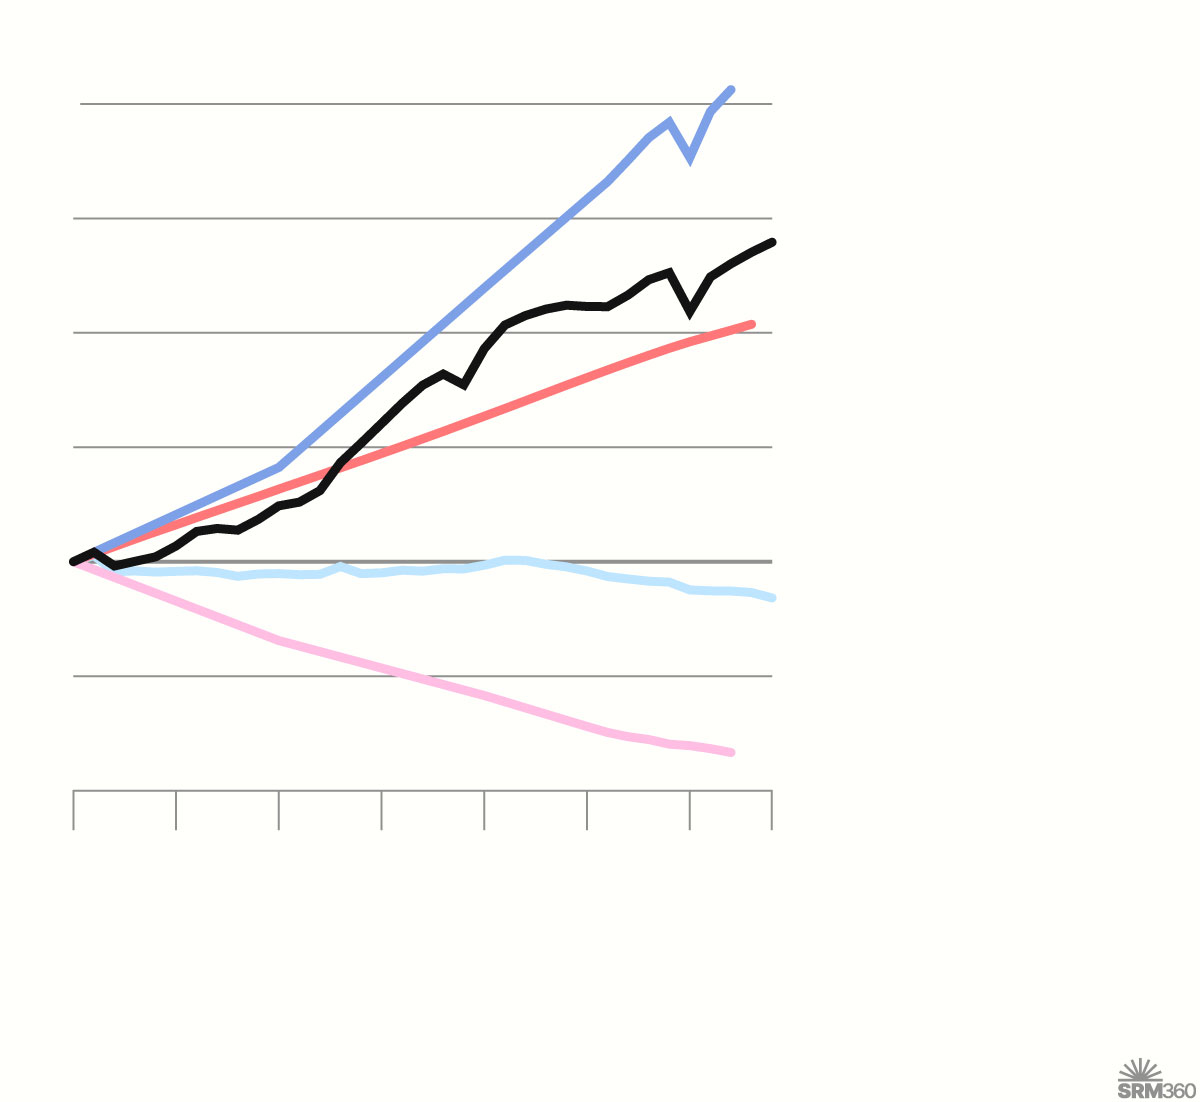
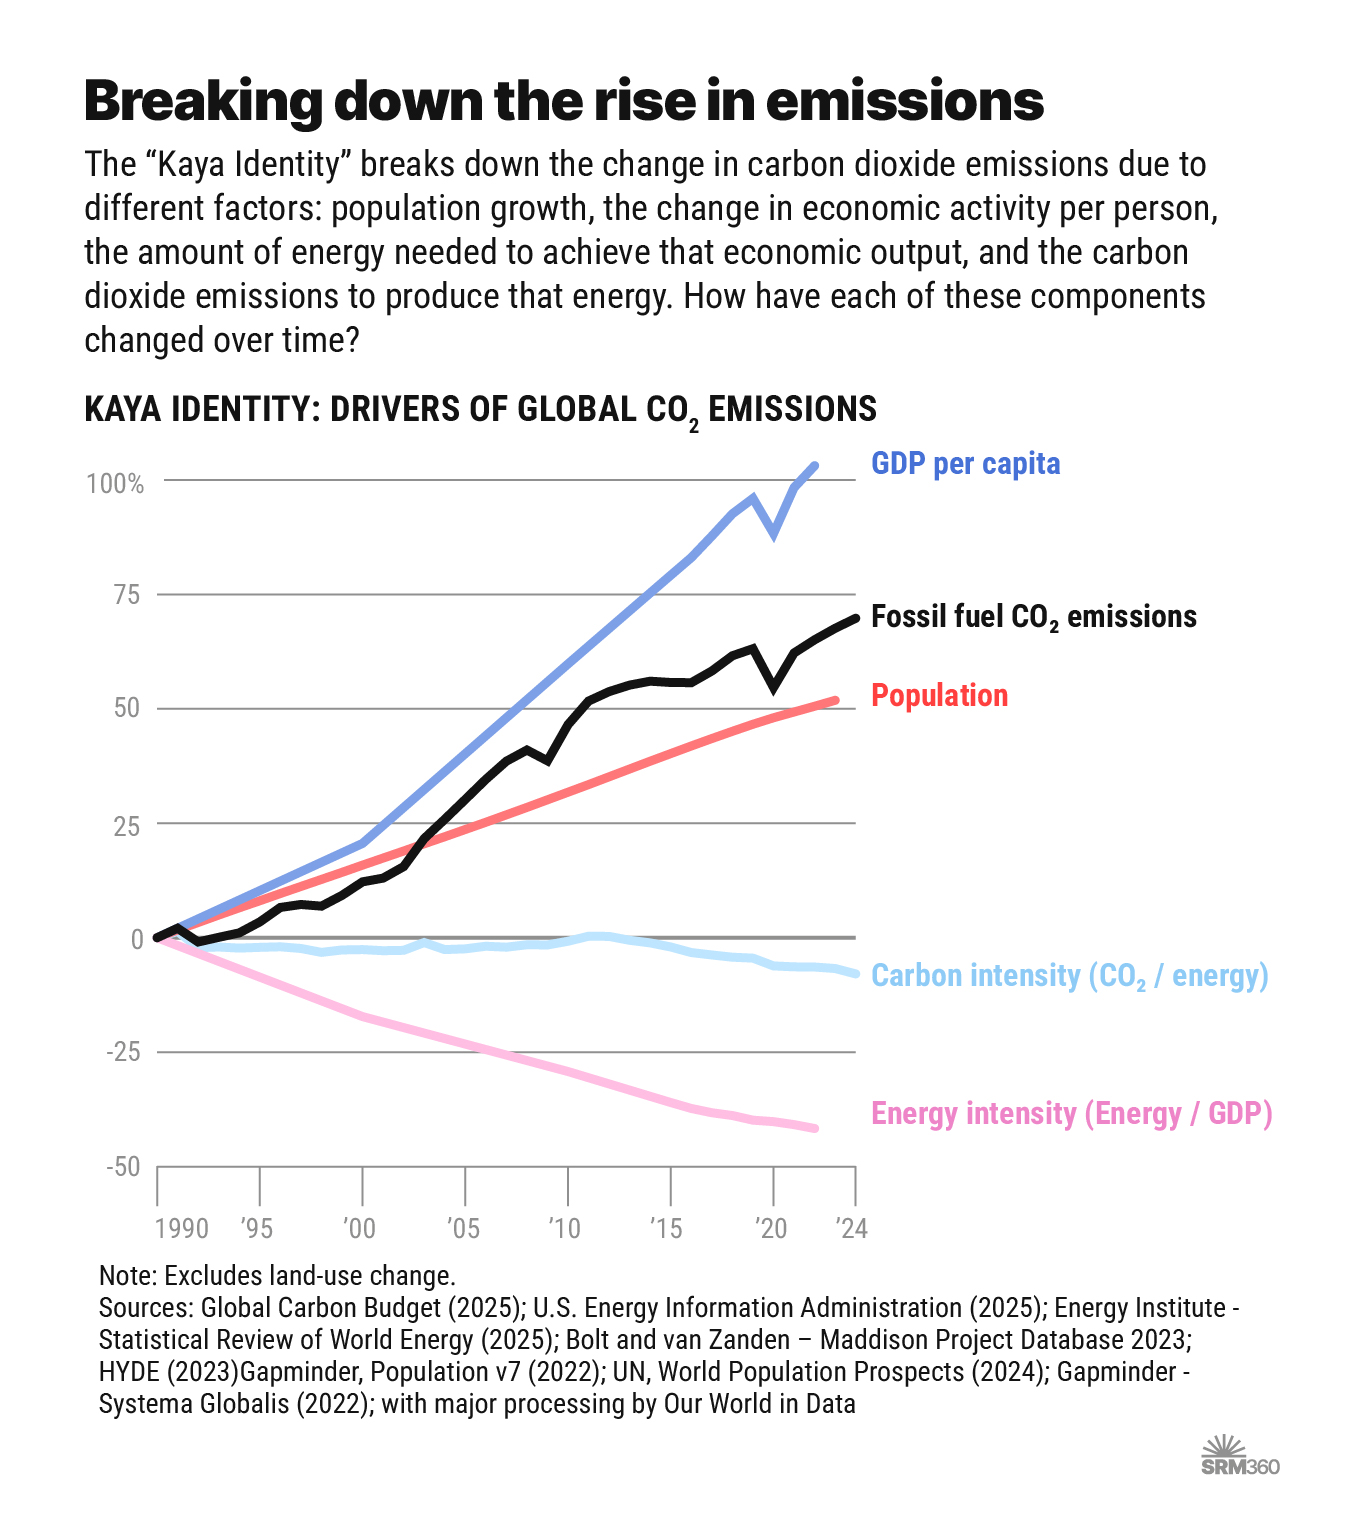
Breaking down the rise in emissions
The “Kaya Identity” breaks down the change in carbon dioxide emissions due to different factors: population growth, the change in economic activity per person, the amount of energy needed to achieve that economic output, and the carbon dioxide emissions to produce that energy. How have each of these components changed over time?
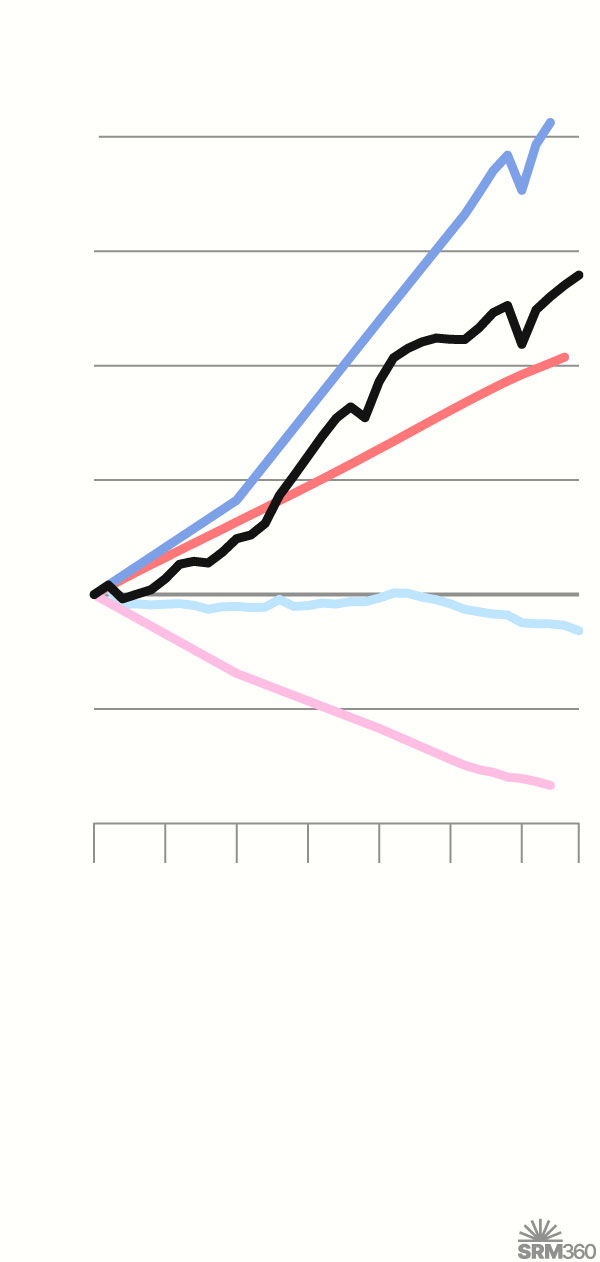
Kaya Identity: drivers of global CO2 emissions
100%
GDP per capita
75
Fossil fuel CO₂ emissions
50
Population
25
Carbon intensity (CO₂ / energy)
0
-25
Energy intensity (Energy / GDP)
-50
’90
’95
’00
’05
’10
’15
’20
’24
Note: Excludes land-use change.
Sources: Global Carbon Budget (2025); U.S. Energy Information Administration (2025); Energy Institute - Statistical Review of World Energy (2025); Bolt and van Zanden – Maddison Project Database 2023; HYDE (2023)Gapminder, Population v7 (2022); UN, World Population Prospects (2024); Gapminder - Systema Globalis (2022); with major processing by Our World in Data
Kaya Identity: drivers of global CO2 emissions
GDP per capita
100%
75
Fossil fuel CO₂ emissions
Population
50
25
0
Carbon intensity (CO₂ / energy)
-25
Energy intensity (Energy / GDP)
-50
1990
’95
’00
’05
’10
’15
’20
’24
Note: Excludes land-use change.
Sources: Global Carbon Budget (2025); U.S. Energy Information Administration (2025); Energy Institute - Statistical Review of World Energy (2025); Bolt and van Zanden – Maddison Project Database 2023; HYDE (2023)Gapminder, Population v7 (2022); UN, World Population Prospects (2024); Gapminder - Systema Globalis (2022); with major processing by Our World in Data
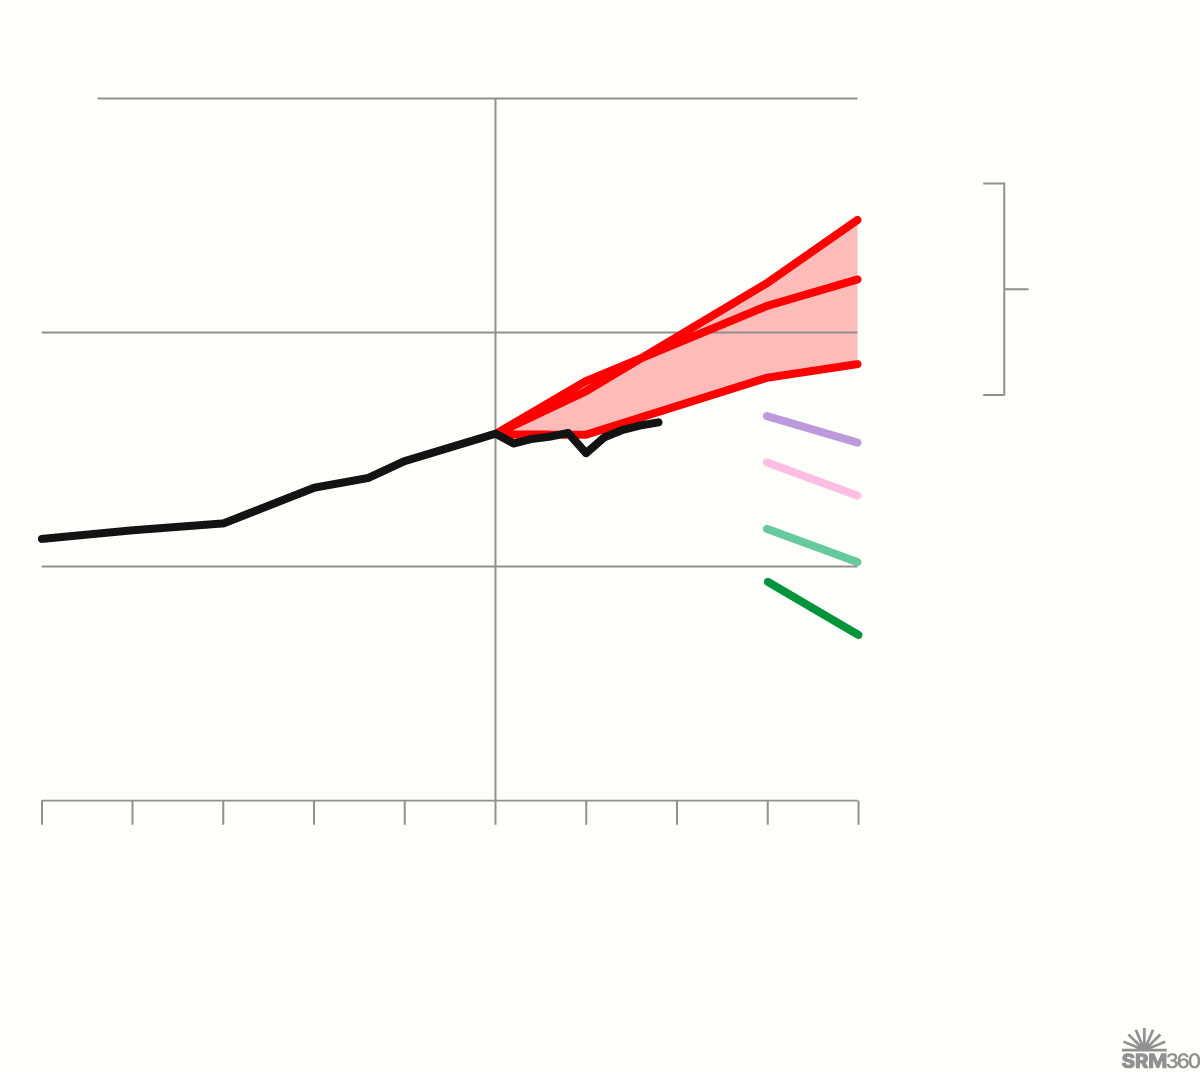
The next ten years of emissions
According to the United Nations Emissions Gap Report, countries’ current policies place emissions well above pathways consistent with 1.5°C or 2°C of global warming. The same is true for countries’ stated targets for emissions cuts, known as Nationally Determined Contributions (NDCs). However, emissions are expected to be lower than some of the more pessimistic emissions pathways.
Total CO2 emissions
75 GtCO2
Avoided emissions pathways
SSP5-8.5
SSP3-7.0
SSP4-6.0
50
Historical
25
Current policies
Conditional NDCs
2C pathway
1.5C pathway
2035
1990
’15
Sources: SSP Public Database – International Institute for Applied Systems Analysis; Global Carbon Budget (2025) – with major processing by Our World in Data; United Nations Environment Programme Emissions Gap Report 2025; normalised to 2015 historic total CO2 emissions.
Total CO2 emissions
75 GtCO2
SSP5-8.5
Avoided emissions pathways
SSP3-7.0
50
SSP4-6.0
Current policies
Historical
Conditional NDCs
2C pathway
25
1.5C pathway
0
1990
’95
’00
’05
’10
’15
’20
’25
2030
2035
Sources: SSP Public Database – International Institute for Applied Systems Analysis; Global Carbon Budget (2025) – with major processing by Our World in Data; United Nations Environment Programme Emissions Gap Report 2025; normalised to 2015 historic total CO2 emissions.
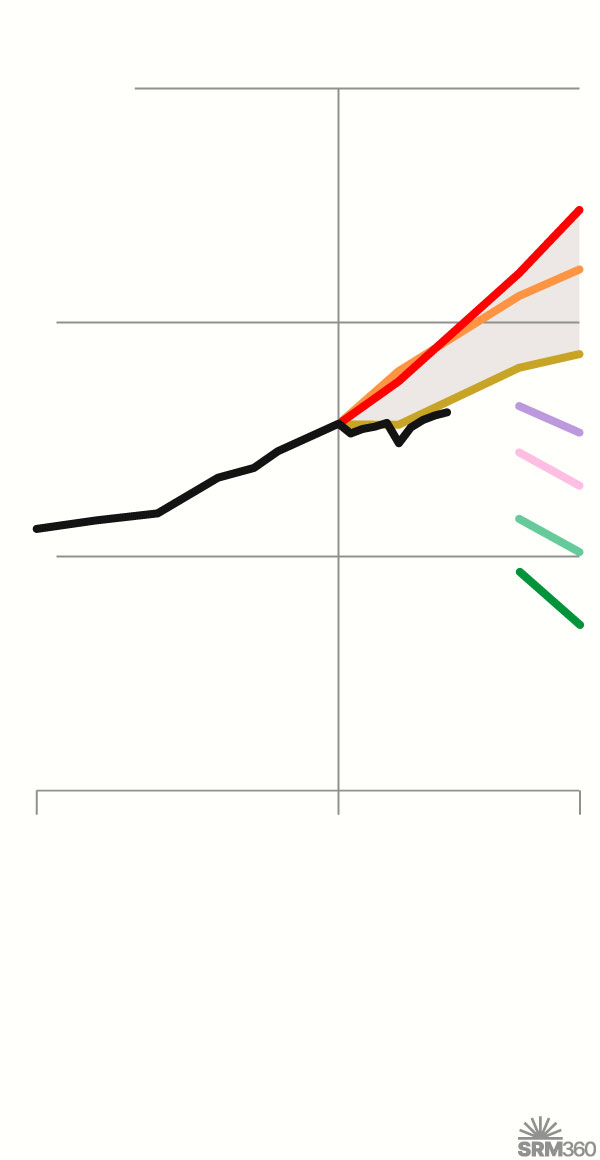
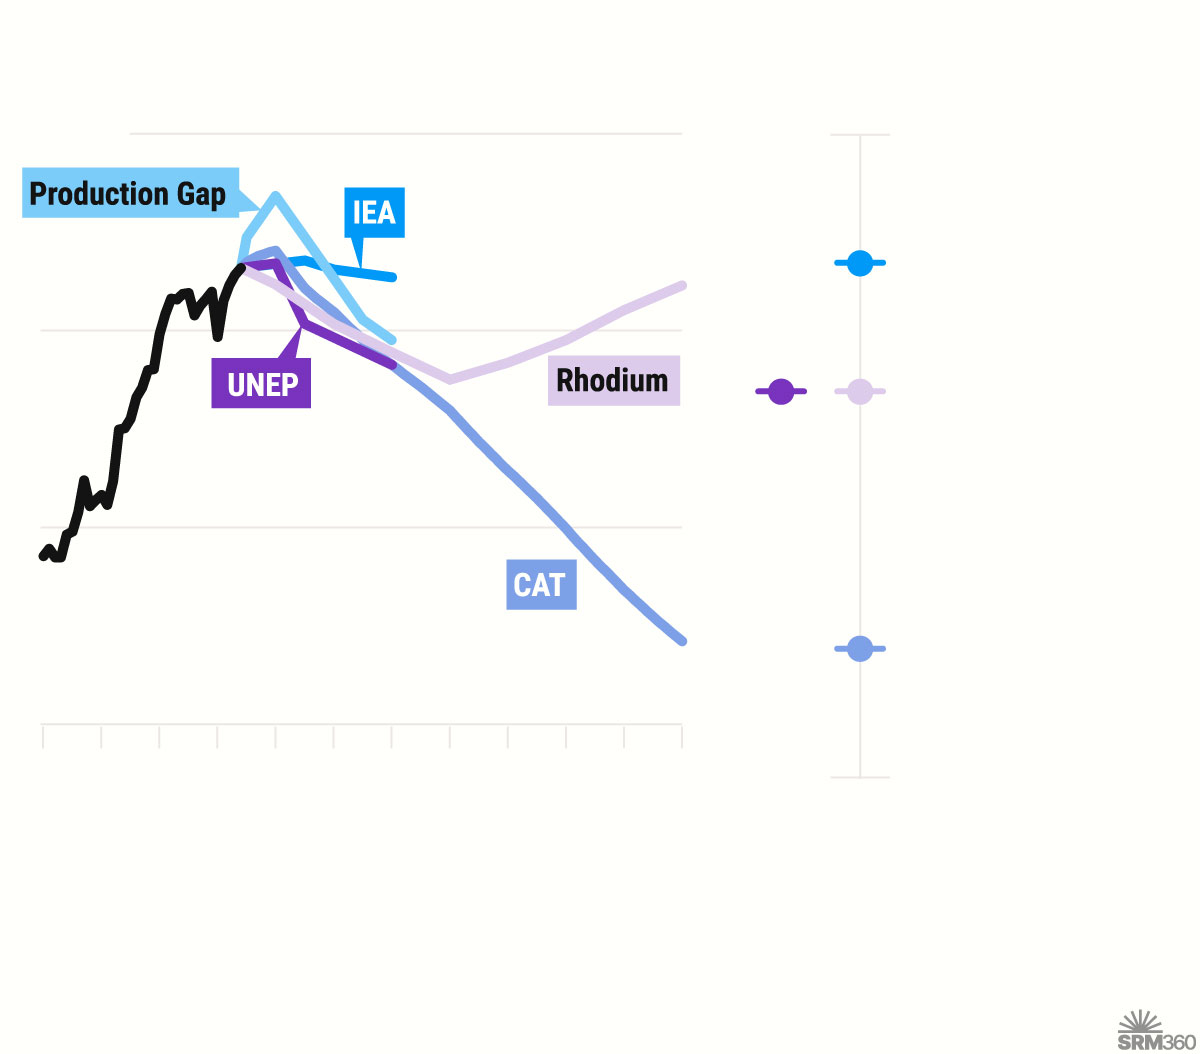
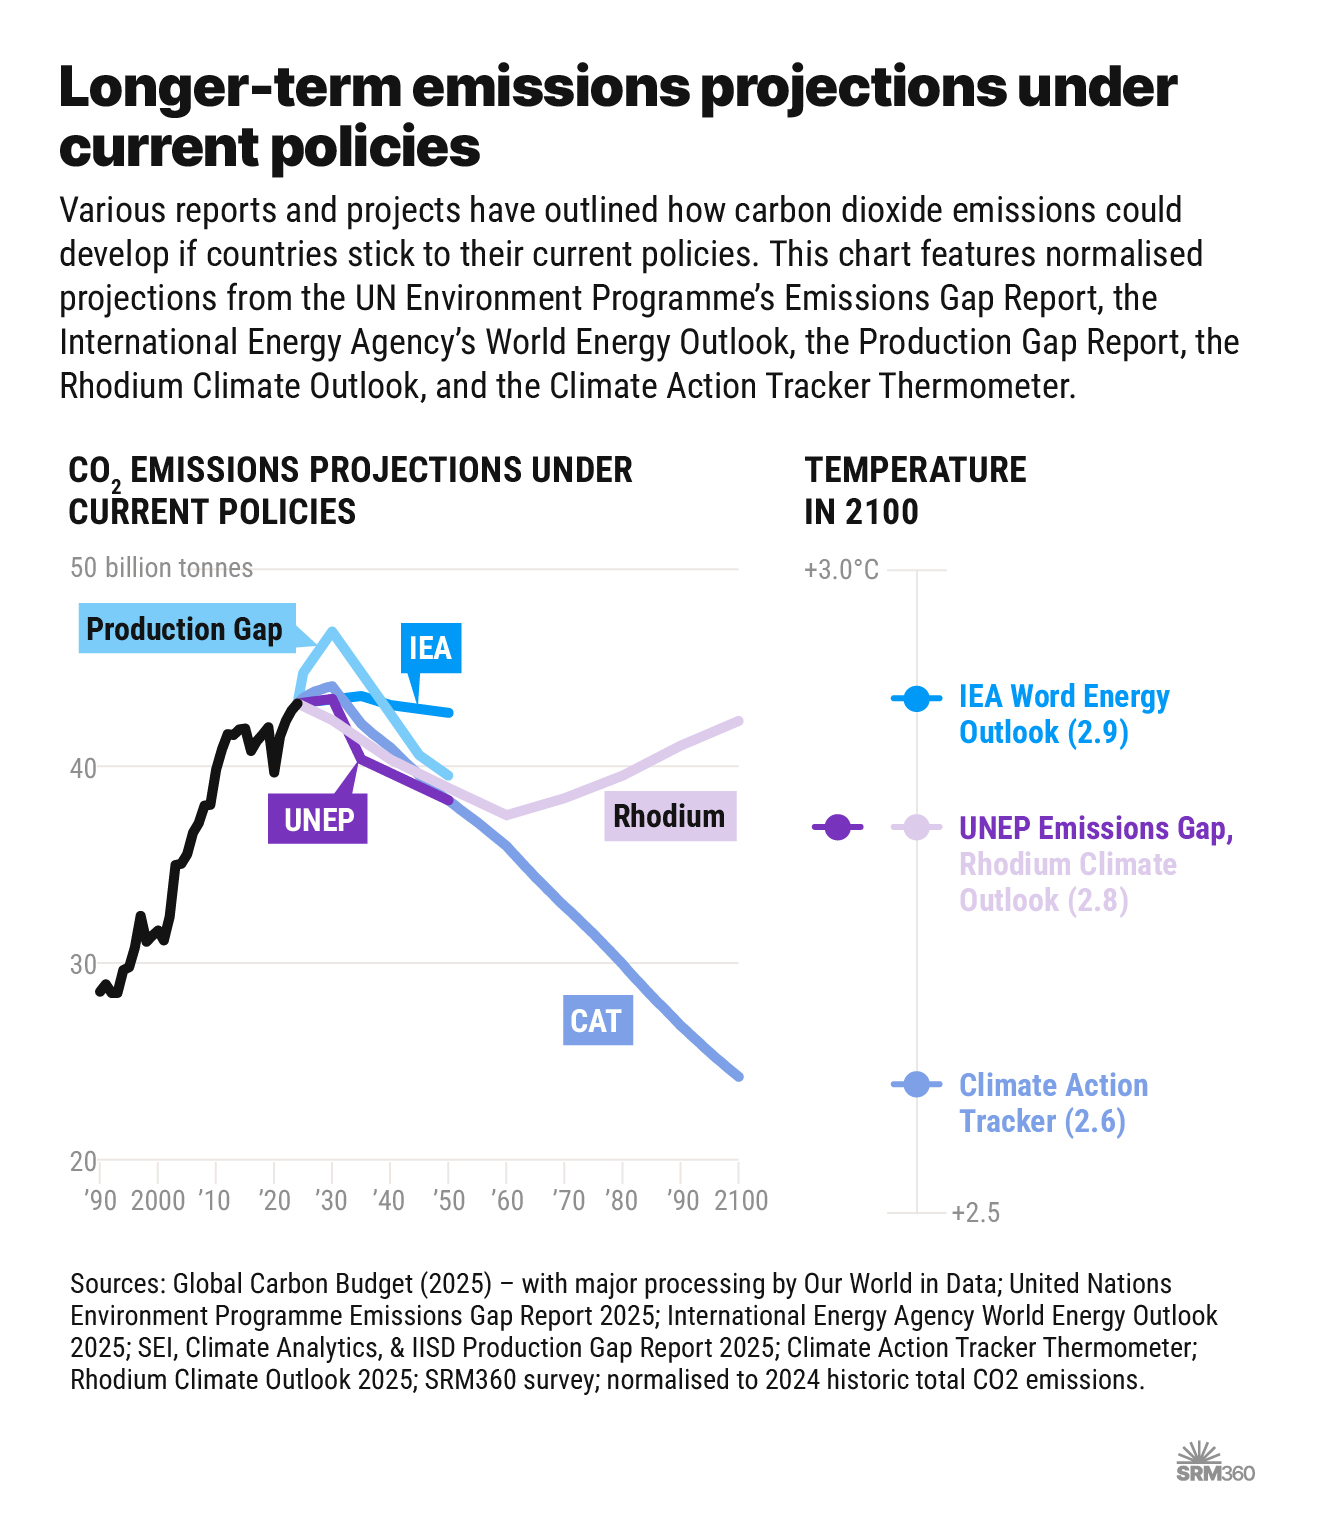
Longer-term emissions projections under current policies
Various reports and projects have outlined how carbon dioxide emissions could develop if countries stick to their current policies. This chart features normalised projections from the UN Environment Programme’s Emissions Gap Report, the International Energy Agency’s World Energy Outlook, the Production Gap Report, the Rhodium Climate Outlook, and the Climate Action Tracker Thermometer.
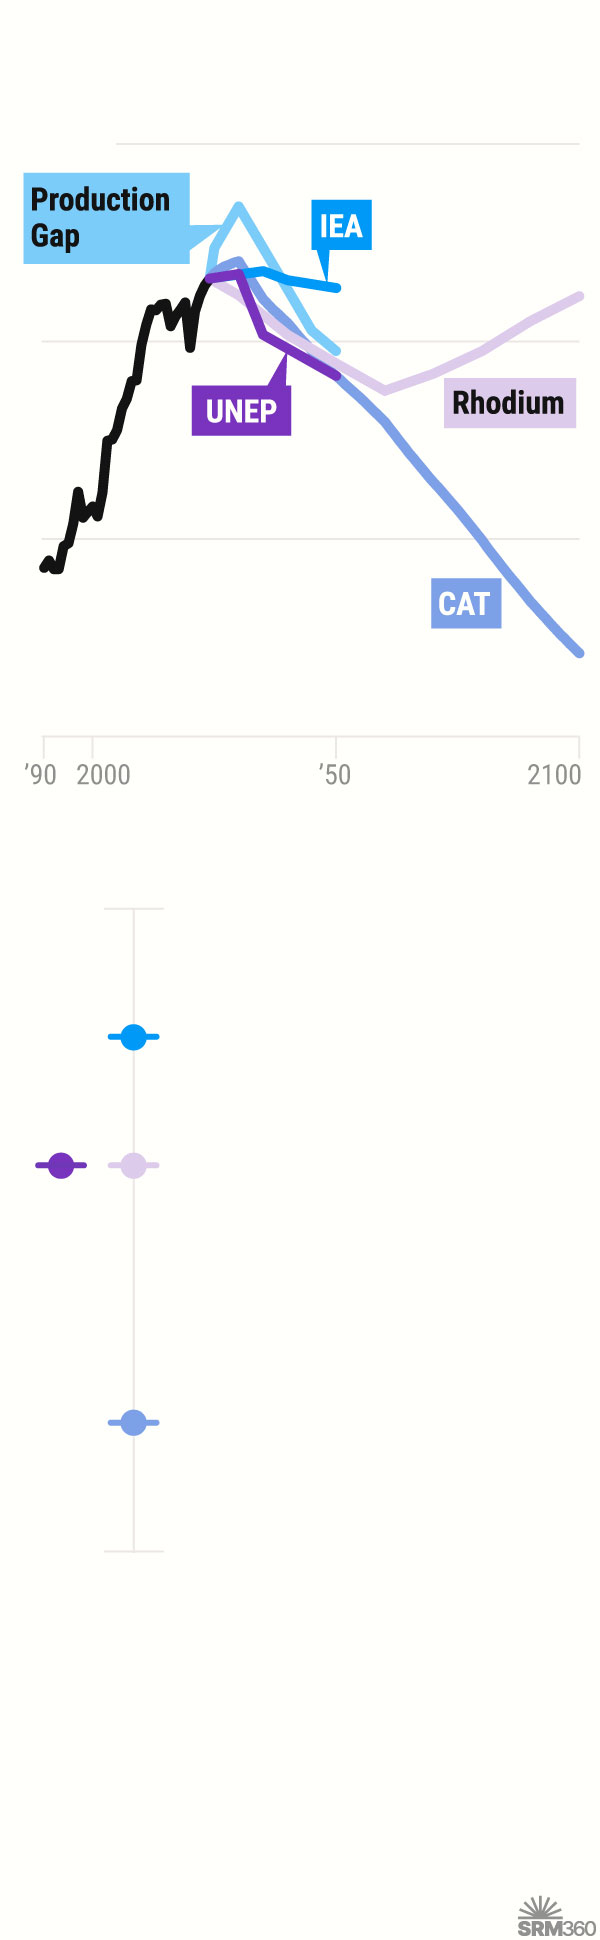
CO2 emissions projections under current policies
50
billion tonnes
40
30
20
’50
2100
’90
2000
Temperature in 2100
+3.0°C
IEA Word Energy Outlook (2.9)
UNEP Emissions Gap,
Rhodium Climate Outlook (2.8)
Climate Action Tracker (2.6)
+2.5
Sources: Global Carbon Budget (2025) – with major processing by Our World in Data; United Nations Environment Programme Emissions Gap Report 2025; International Energy Agency World Energy Outlook 2025; SEI, Climate Analytics, & IISD Production Gap Report 2025; Climate Action Tracker Thermometer; Rhodium Climate Outlook 2025; SRM360 survey; normalised to 2024 historic total CO2 emissions.
Temperature in 2100
CO2 emissions projections under current policies
50
billion tonnes
+3.0°C
IEA Word Energy Outlook (2.9)
40
UNEP Emissions Gap,
Rhodium Climate Outlook (2.8)
30
Climate Action Tracker (2.6)
20
’50
’60
’70
’80
’90
2100
’90
2000
’10
’20
’30
’40
+2.5
Sources: Global Carbon Budget (2025) – with major processing by Our World in Data; United Nations Environment Programme Emissions Gap Report 2025; International Energy Agency World Energy Outlook 2025; SEI, Climate Analytics, & IISD Production Gap Report 2025; Climate Action Tracker Thermometer; Rhodium Climate Outlook 2025; SRM360 survey; normalised to 2024 historic total CO2 emissions.