Graphic
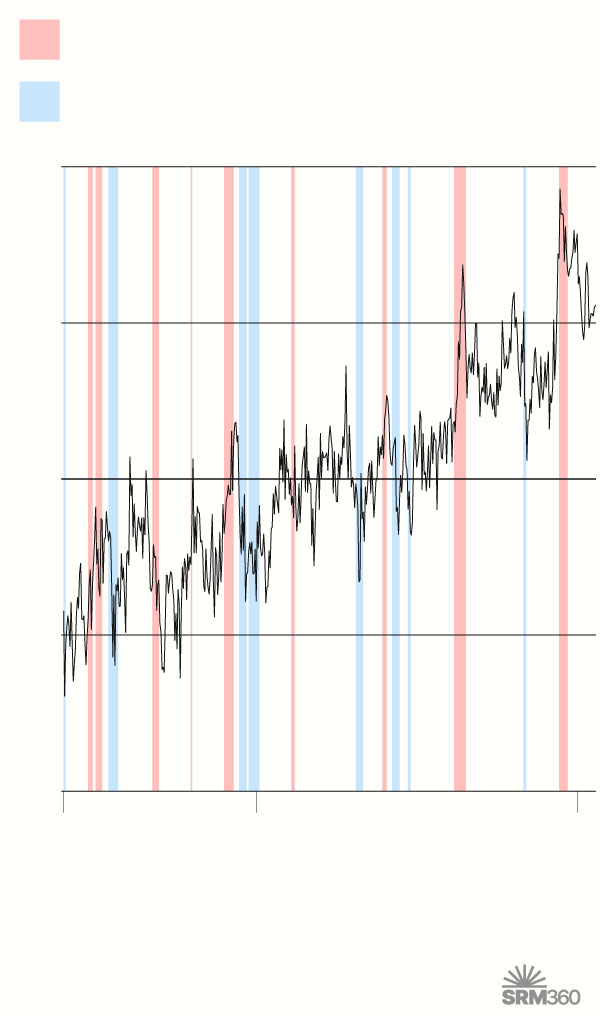
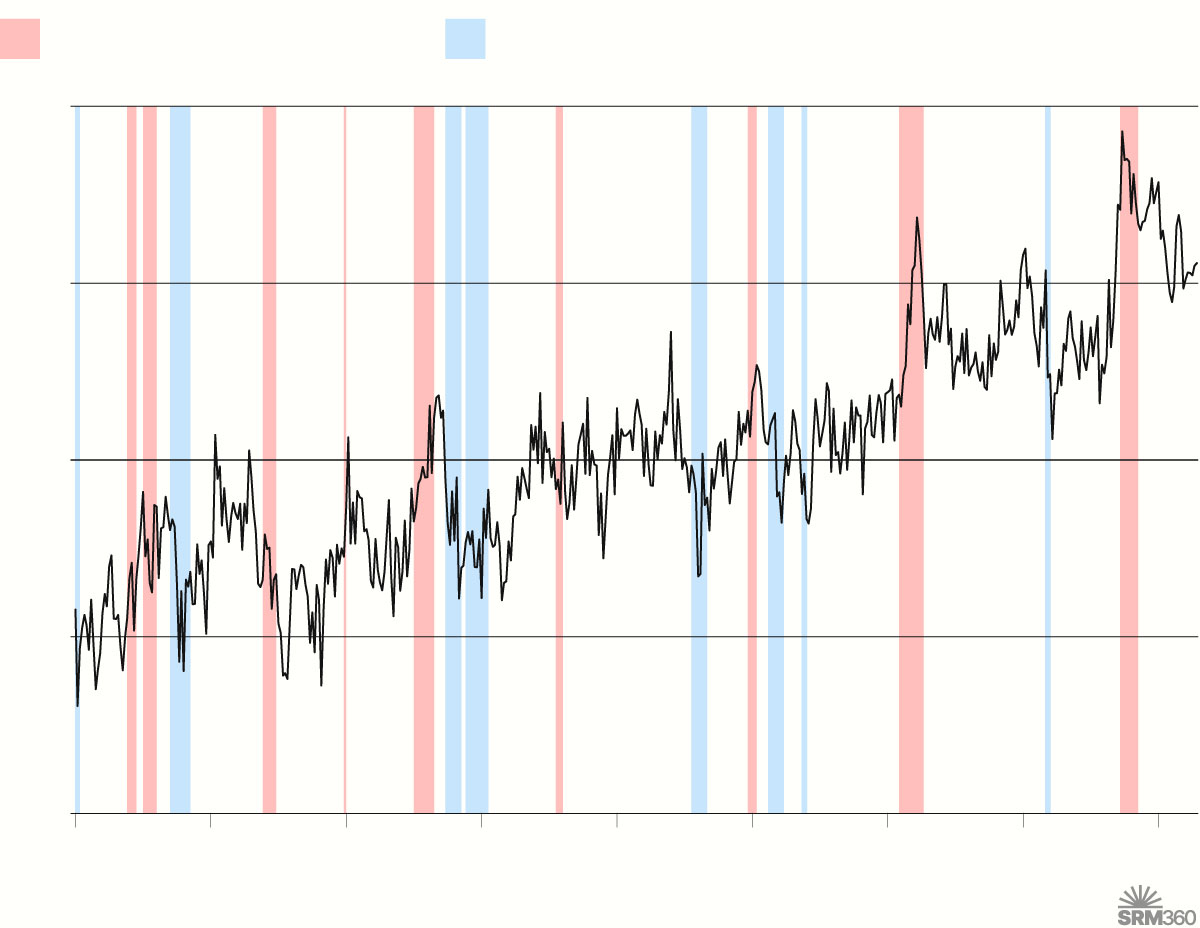
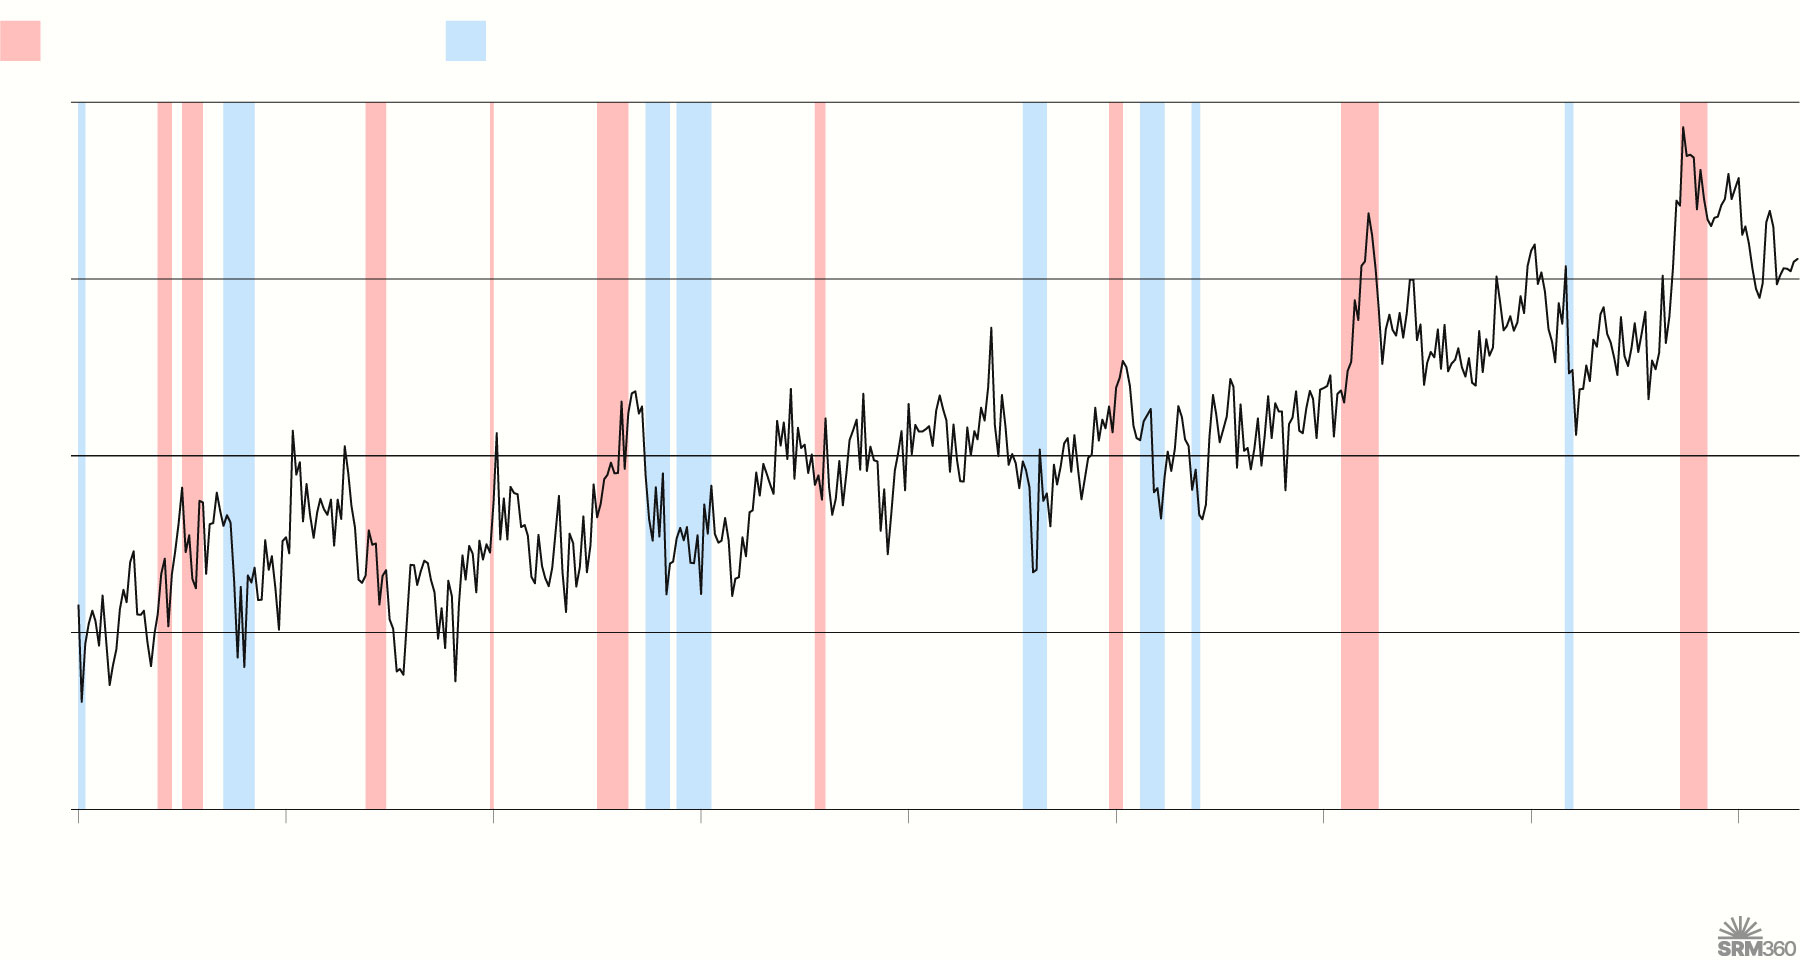
Global temperature anomalies
Global average temperatures for each month relative to the 1991–2020 average, with El Niño and La Niña classifications based on the Oceanic Niño Index, which tracks surface temperatures in the central Pacific Ocean.
Strong El Niño conditions
Strong La Niña conditions
1.0°C
0.5
0
–0.5
–1.0
1985
2000
2025
Source: Copernicus Climate Change Service (2026) – with major processing by Our World in Data
Strong El Niño conditions
Strong La Niña conditions
1.0
°C
0.5
0
–0.5
–1.0
1985
'90
'95
'00
'05
'10
'15
'20
'25
Source: Copernicus Climate Change Service (2026) – with major processing by Our World in Data
Strong El Niño conditions
Strong La Niña conditions
°C
1.0
0.5
0
–0.5
–1.0
1985
1990
1995
2000
2005
2010
2015
2020
2025
Source: Copernicus Climate Change Service (2026) – with major processing by Our World in Data
Citation
SRM360
(2026) – "Global temperature anomalies" [Infographic]. Published online at SRM360.org. Retrieved from: 'https://srm360.org/infographic/global-temperature-anomalies/' [Online Resource]