Graphic
Regions with monsoons
This map shows which regions receive monsoon rainfall based on the IPCC’s “global monsoon” definition, which identifies areas receiving at least 2.5 mm more rainfall per day in summer than winter.
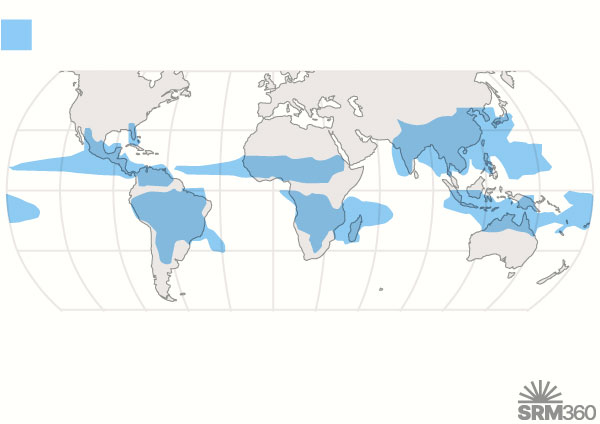
Global monsoon areas
Source: IPCC, Sixth Assessment Report, Working Group 1: The Physical Science Basis
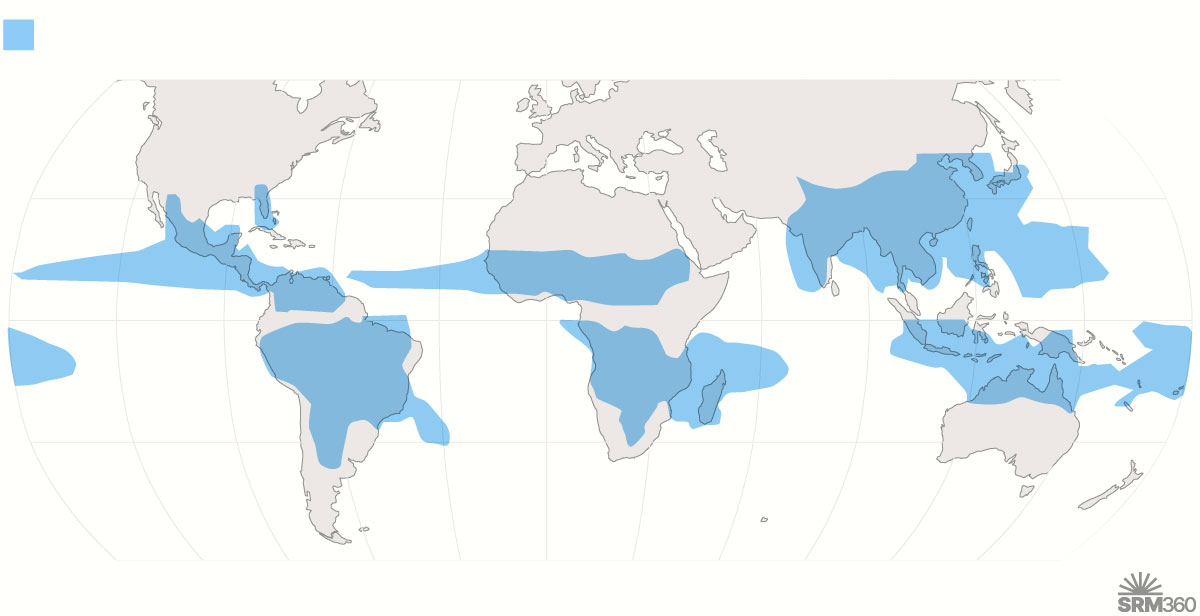
Global monsoon areas
Source: IPCC, Sixth Assessment Report, Working Group 1: The Physical Science Basis
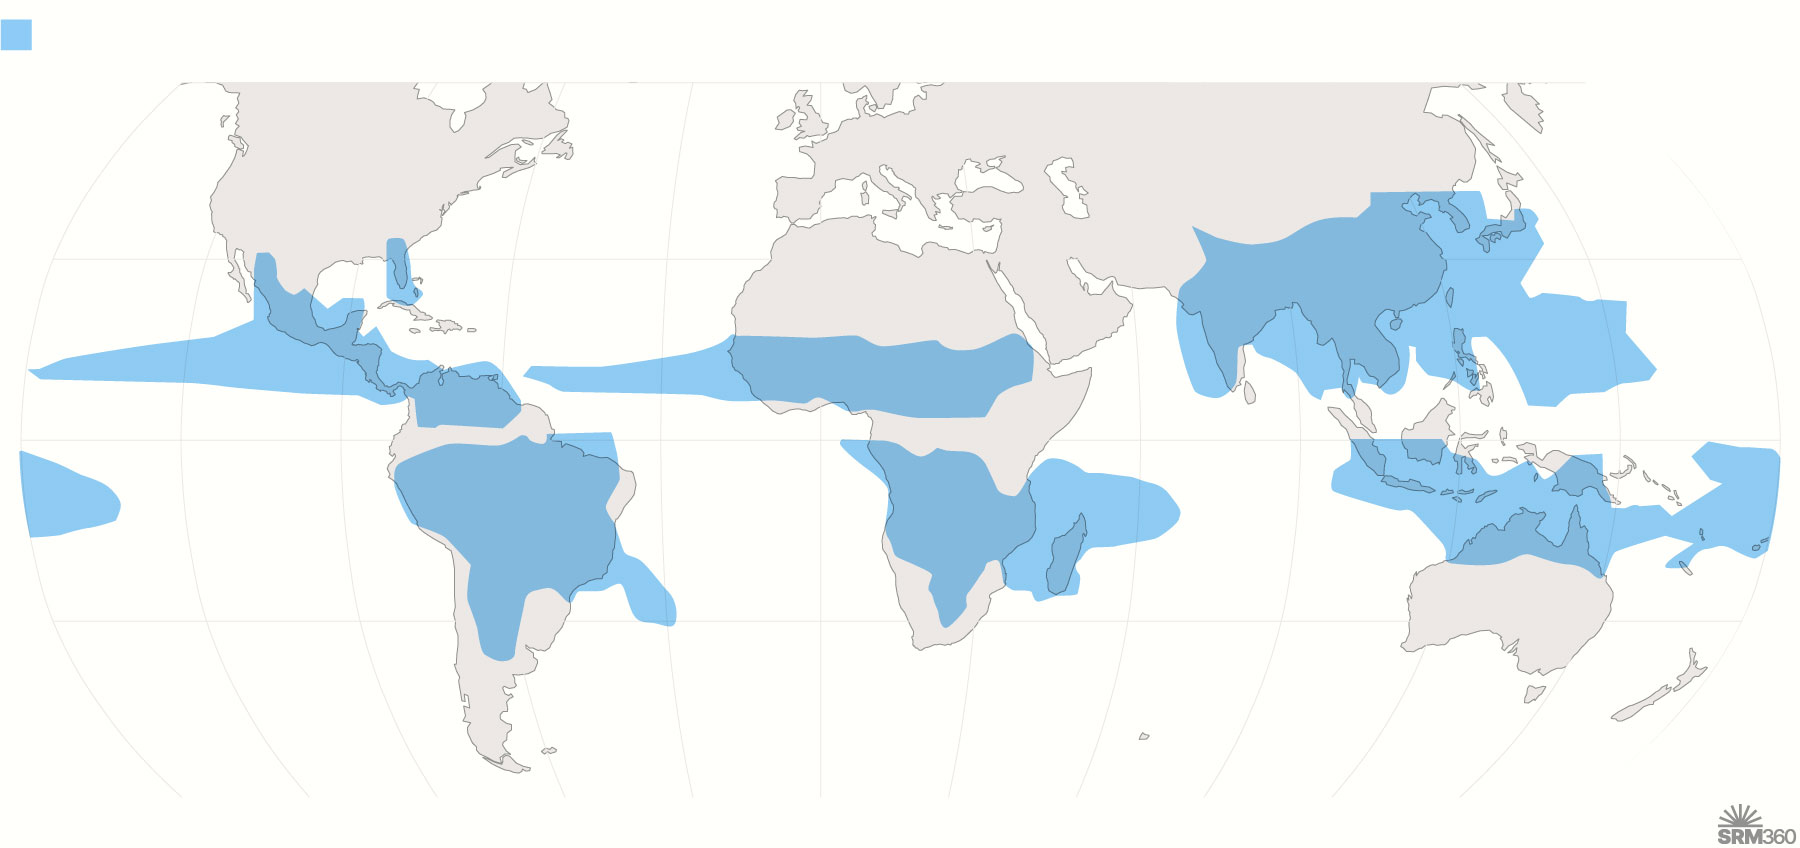
Global monsoon areas
Source: IPCC, Sixth Assessment Report, Working Group 1: The Physical Science Basis
Citation
SRM360
(2026) – "Regions with monsoons" [Infographic]. Published online at SRM360.org. Retrieved from: 'https://srm360.org/infographic/regions-with-monsoons/' [Online Resource]