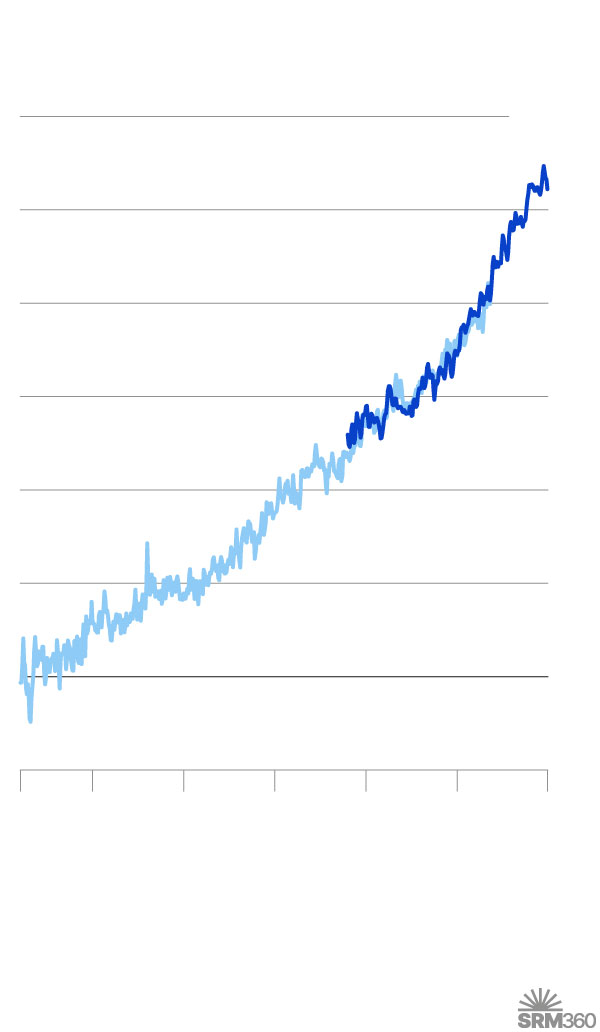
CHANGE IN GLOBAL SEA LEVEL SINCE 1880
30
cm
25
20
15
10
5
0
-5
’80
’25
’50
’75
2000
’24
1900
Sources: NOAA analysis of seasonal (3-month) sea level estimates from Church & White (2011), Surveys in Geophysics (light blue line) and the University of Hawaii Sea Level Center
(dark blue line)
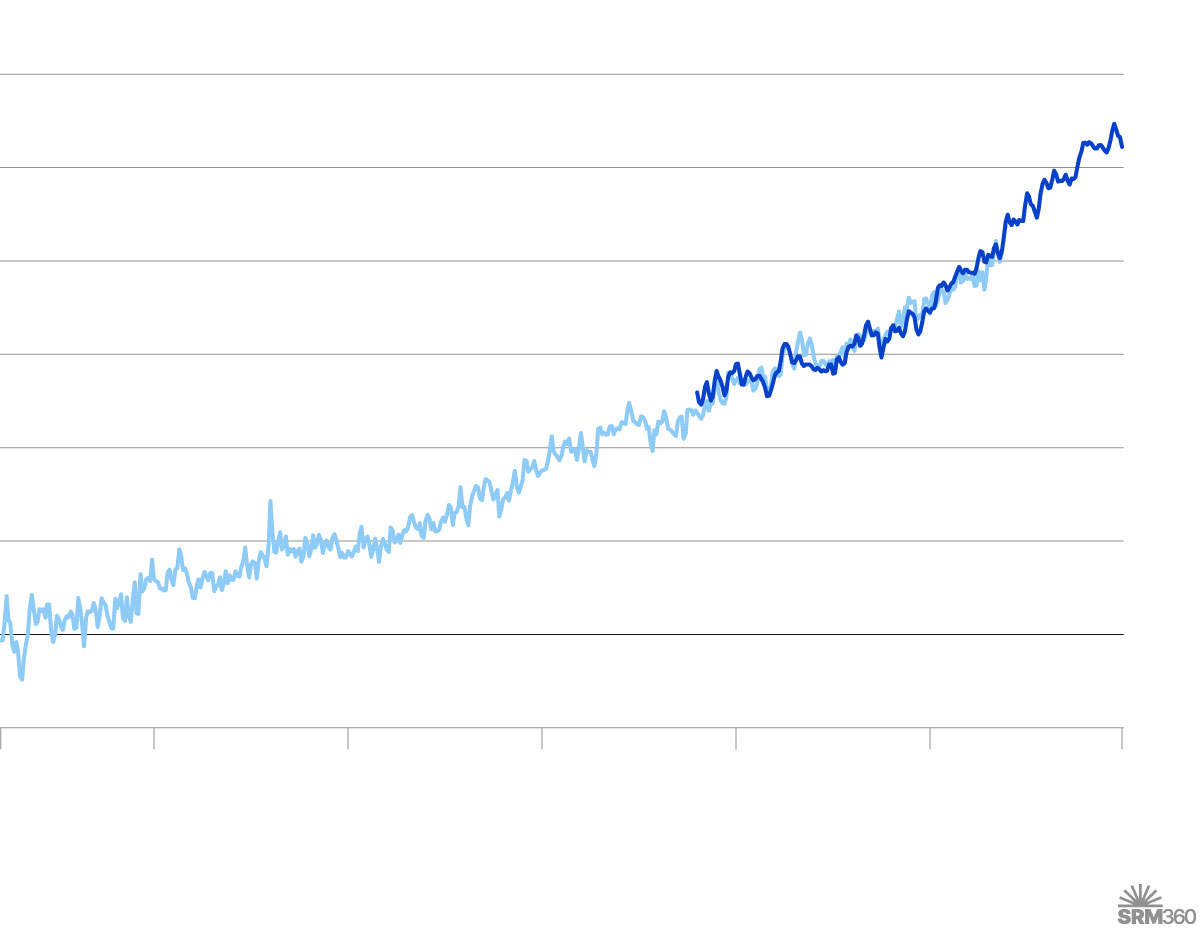
CHANGE IN GLOBAL SEA LEVEL SINCE 1880
30
cm
25
20
15
10
5
0
-5
1880
1900
1925
1950
1975
2000
2024
Sources: NOAA analysis of seasonal (3-month) sea level estimates from Church & White (2011), Surveys in Geophysics (light blue line) and the University of Hawaii Sea Level Center (dark blue line)
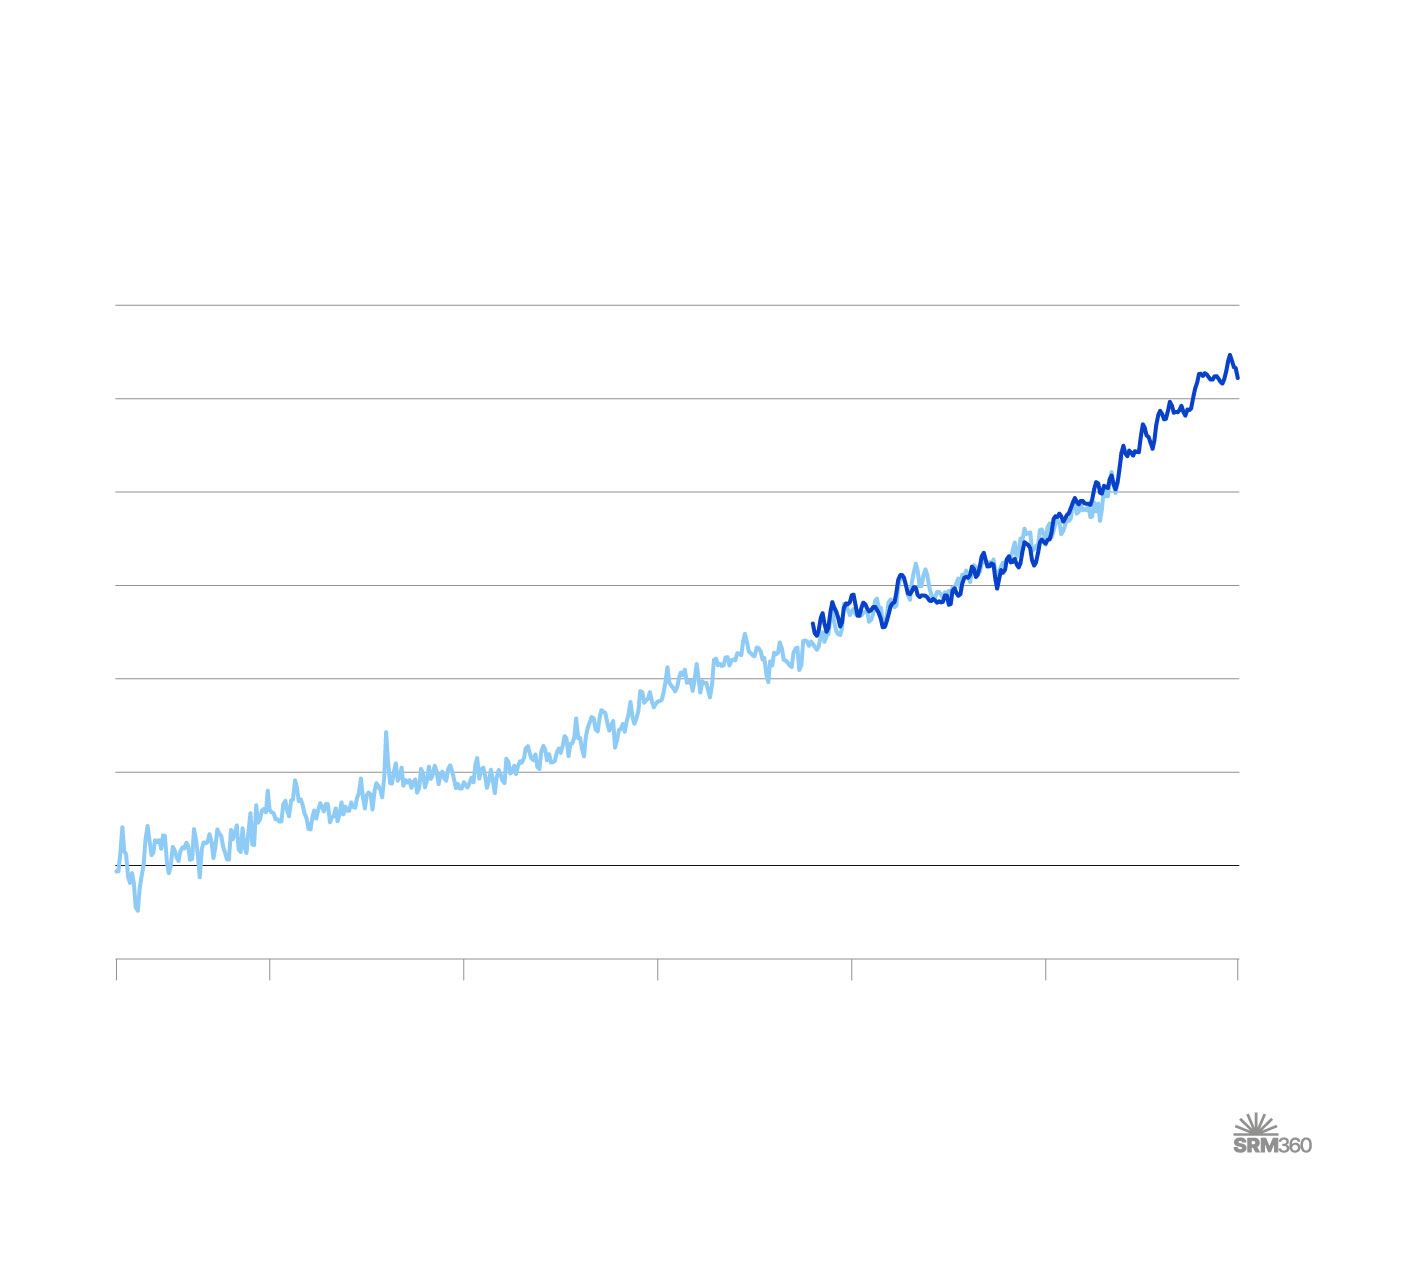
Sea-level rise
Global average sea level has risen 26.6 cm (10.5 inches) since 1880.
CHANGE IN GLOBAL SEA LEVEL SINCE 1880
30
cm
25
20
15
10
5
0
-5
1880
1900
1925
1950
1975
2000
2024
Sources: NOAA analysis of seasonal (3-month) sea level estimates from Church & White (2011), Surveys in Geophysics (light blue line) and the University of Hawaii Sea Level Center (dark blue line)