Graphic
Breaking down the rise in emissions
The “Kaya Identity” breaks down the change in carbon dioxide emissions due to different factors: population growth, the change in economic activity per person, the amount of energy needed to achieve that economic output, and the carbon dioxide emissions to produce that energy. How have each of these components changed over time?
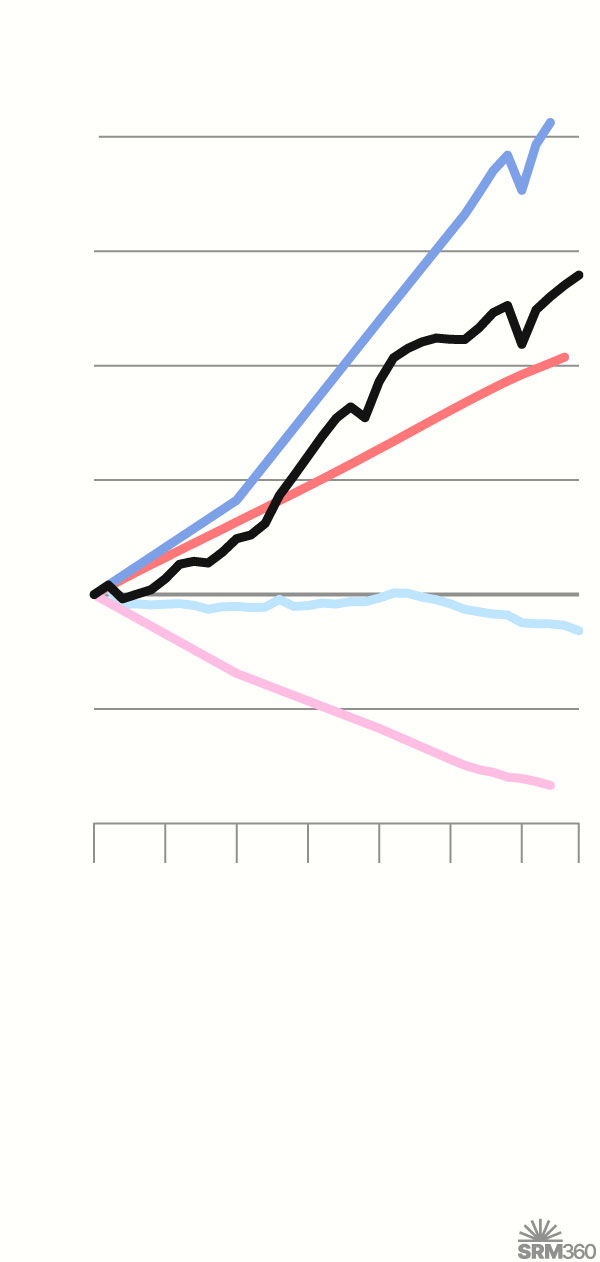
Kaya Identity: drivers of global CO2 emissions
100%
GDP per capita
75
Fossil fuel CO₂ emissions
50
Population
25
Carbon intensity (CO₂ / energy)
0
-25
Energy intensity (Energy / GDP)
-50
’90
’95
’00
’05
’10
’15
’20
’24
Note: Excludes land-use change.
Sources: Global Carbon Budget (2025); U.S. Energy Information Administration (2025); Energy Institute - Statistical Review of World Energy (2025); Bolt and van Zanden – Maddison Project Database 2023; HYDE (2023)Gapminder, Population v7 (2022); UN, World Population Prospects (2024); Gapminder - Systema Globalis (2022); with major processing by Our World in Data
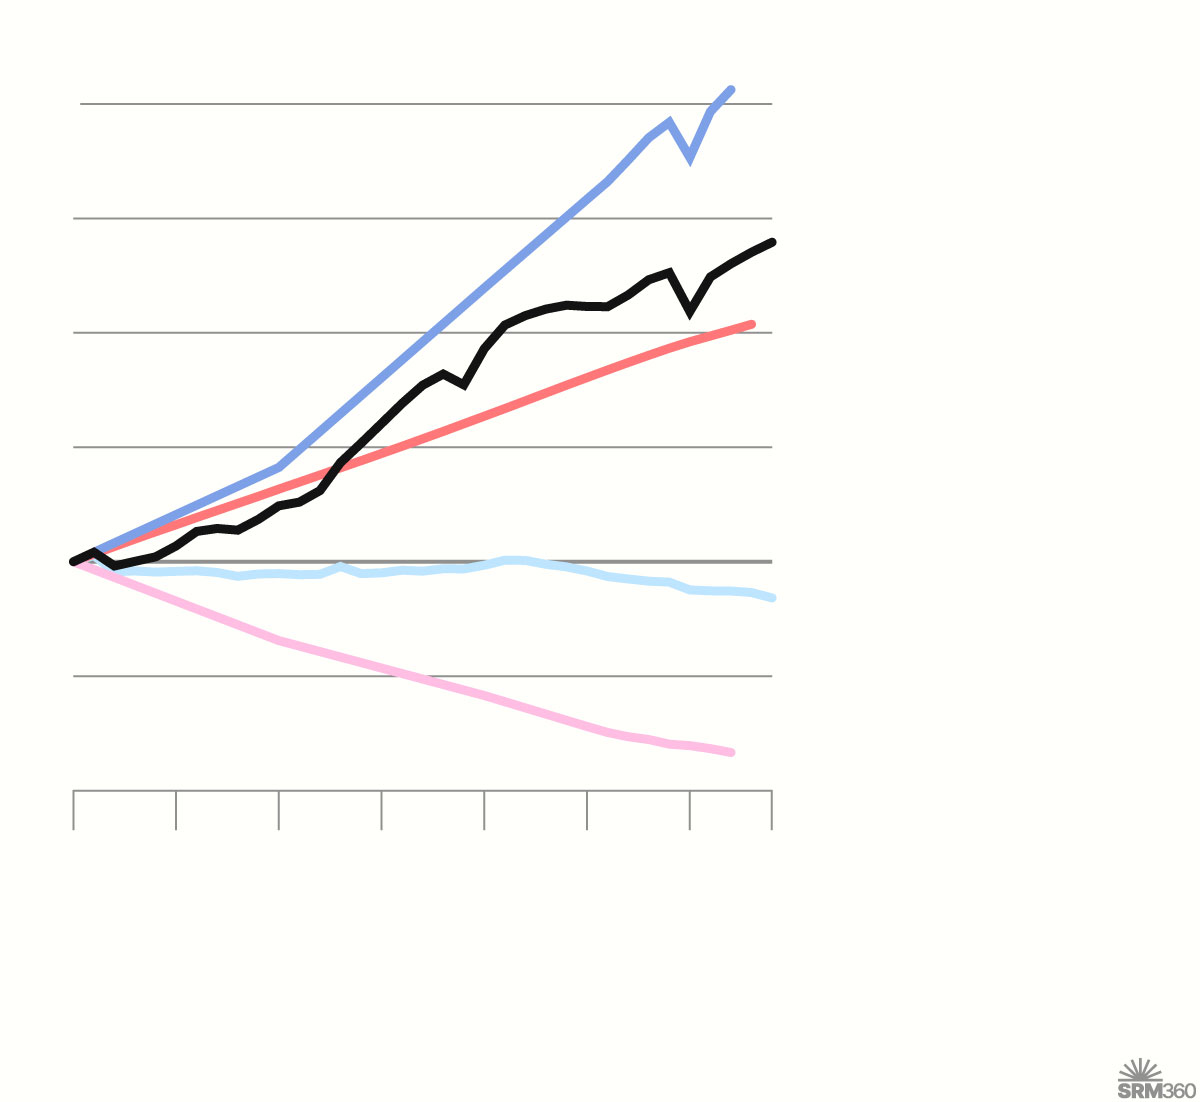
Kaya Identity: drivers of global CO2 emissions
GDP per capita
100%
75
Fossil fuel CO₂ emissions
Population
50
25
0
Carbon intensity (CO₂ / energy)
-25
Energy intensity (Energy / GDP)
-50
1990
’95
’00
’05
’10
’15
’20
’24
Note: Excludes land-use change.
Sources: Global Carbon Budget (2025); U.S. Energy Information Administration (2025); Energy Institute - Statistical Review of World Energy (2025); Bolt and van Zanden – Maddison Project Database 2023; HYDE (2023)Gapminder, Population v7 (2022); UN, World Population Prospects (2024); Gapminder - Systema Globalis (2022); with major processing by Our World in Data
