Graphic
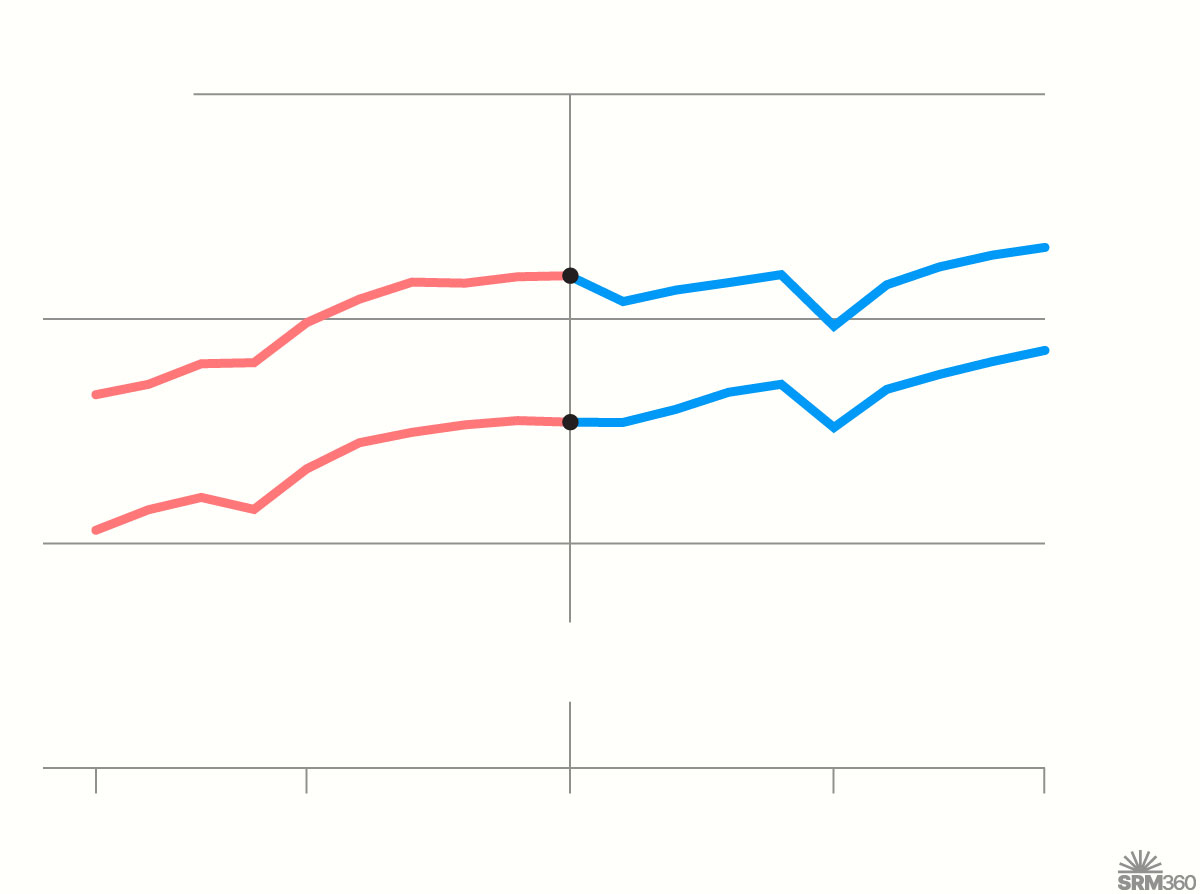
Emissions before and after the Paris Agreement
The adoption of the Paris Agreement in December 2015 was a landmark moment for international climate policy. It introduced the 1.5°C target and requires countries to set goals for reducing emissions, among other measures. How do emissions in the nine years before the Paris Agreement compare to the nine years after?
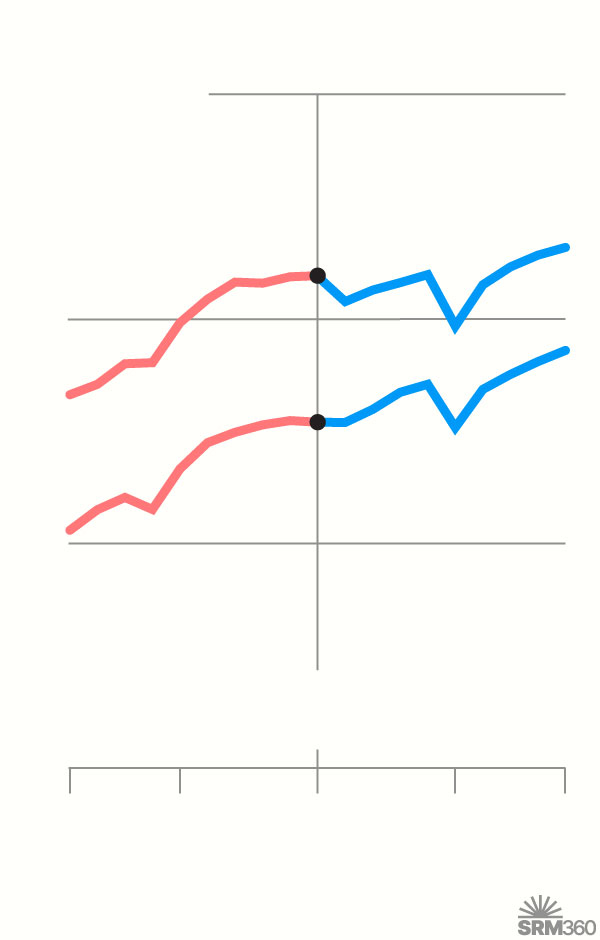
CO₂ emissions
50 billion tonnes
Pre-Paris
Post-Paris
UP 14%
UP 3%
40
UP 9%
Total
UP 16%
30
Fossil fuels
Paris adopted
(2015)
20
’06
’10
’20
’24
Source: Global Carbon Budget (2025) via Our World in Data
CO₂ emissions
50 billion tonnes
Pre-Paris
Post-Paris
UP 14%
UP 3%
Total
40
Fossil fuels
UP 9%
UP 16%
30
Paris adopted
(2015)
20
2006
2010
2020
2024
Source: Global Carbon Budget (2025) via Our World in Data


Citation
SRM360
(2025) – "Emissions before and after the Paris Agreement" [Infographic]. Published online at SRM360.org. Retrieved from: 'https://srm360.org/infographic/emissions-before-and-after-the-paris-agreement/' [Online Resource]