Graphic
Longer-term emissions projections under current policies
Various reports and projects have outlined how carbon dioxide emissions could develop if countries stick to their current policies. This chart features normalised projections from the UN Environment Programme’s Emissions Gap Report, the International Energy Agency’s World Energy Outlook, the Production Gap Report, the Rhodium Climate Outlook, and the Climate Action Tracker Thermometer.
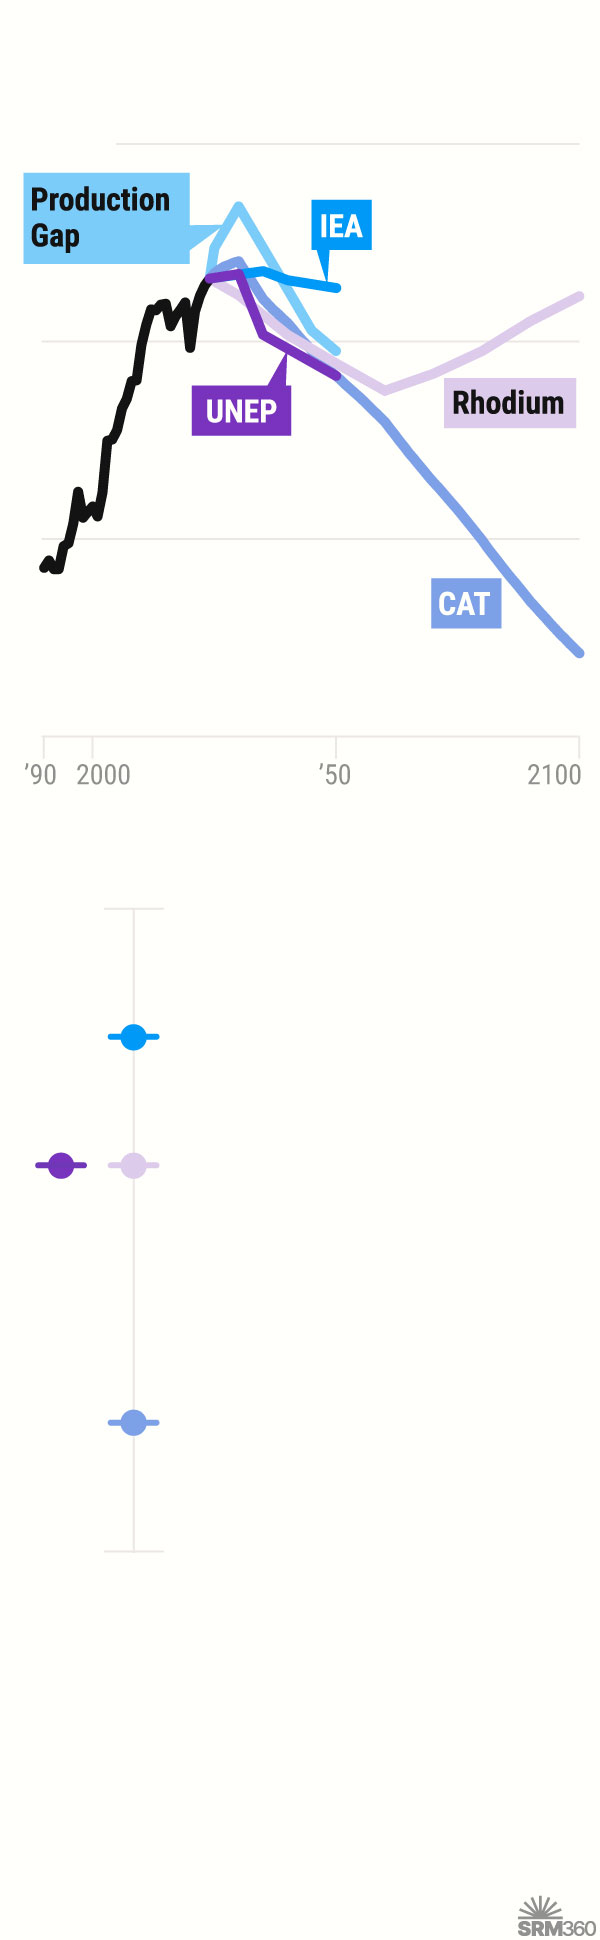
CO2 emissions projections under current policies
50
billion tonnes
40
30
20
’50
2100
’90
2000
Temperature in 2100
+3.0°C
IEA Word Energy Outlook (2.9)
UNEP Emissions Gap,
Rhodium Climate Outlook (2.8)
Climate Action Tracker (2.6)
+2.5
Sources: Global Carbon Budget (2025) – with major processing by Our World in Data; United Nations Environment Programme Emissions Gap Report 2025; International Energy Agency World Energy Outlook 2025; SEI, Climate Analytics, & IISD Production Gap Report 2025; Climate Action Tracker Thermometer; Rhodium Climate Outlook 2025; SRM360 survey; normalised to 2024 historic total CO2 emissions.
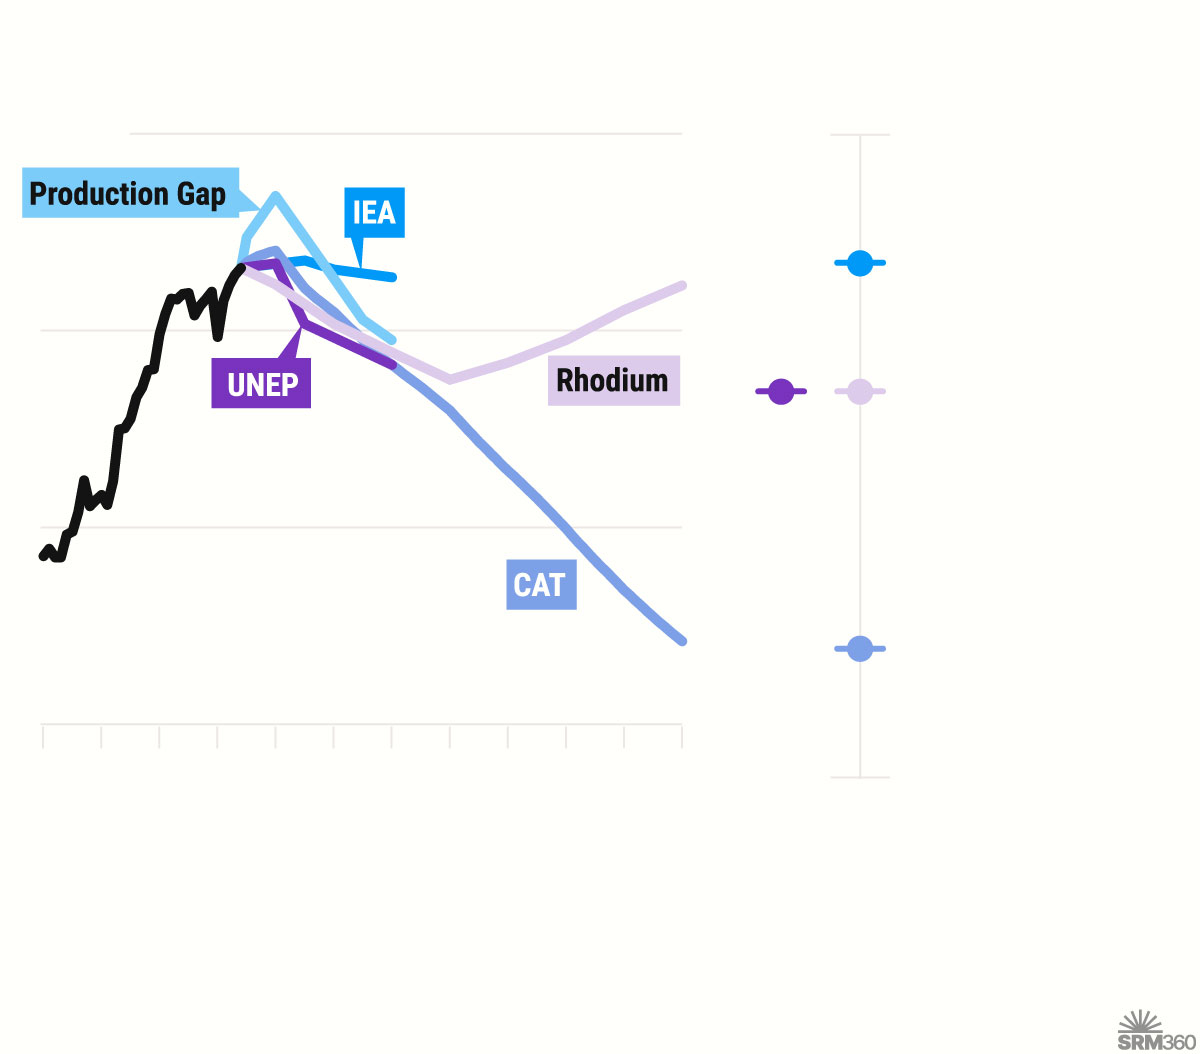
Temperature in 2100
CO2 emissions projections under current policies
50
billion tonnes
+3.0°C
IEA Word Energy Outlook (2.9)
40
UNEP Emissions Gap,
Rhodium Climate Outlook (2.8)
30
Climate Action Tracker (2.6)
20
’50
’60
’70
’80
’90
2100
’90
2000
’10
’20
’30
’40
+2.5
Sources: Global Carbon Budget (2025) – with major processing by Our World in Data; United Nations Environment Programme Emissions Gap Report 2025; International Energy Agency World Energy Outlook 2025; SEI, Climate Analytics, & IISD Production Gap Report 2025; Climate Action Tracker Thermometer; Rhodium Climate Outlook 2025; SRM360 survey; normalised to 2024 historic total CO2 emissions.
