Graphic
The next ten years of emissions
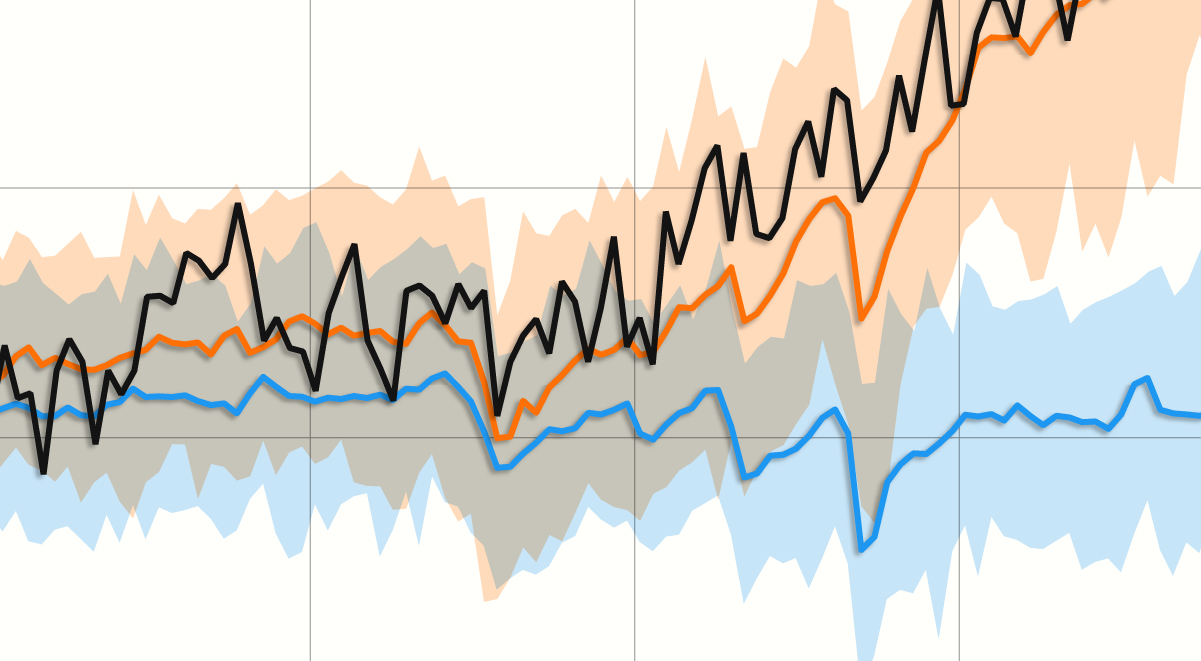
According to the United Nations Emissions Gap Report, countries’ current policies place emissions well above pathways consistent with 1.5°C or 2°C of global warming. The same is true for countries’ stated targets for emissions cuts, known as Nationally Determined Contributions (NDCs). However, emissions are expected to be lower than some of the more pessimistic emissions pathways.
Total CO2 emissions
75 GtCO2
Avoided emissions pathways
SSP5-8.5
SSP3-7.0
SSP4-6.0
50
Historical
25
Current policies
Conditional NDCs
2C pathway
1.5C pathway
2035
1990
’15
Sources: SSP Public Database – International Institute for Applied Systems Analysis; Global Carbon Budget (2025) – with major processing by Our World in Data; United Nations Environment Programme Emissions Gap Report 2025; normalised to 2015 historic total CO2 emissions.
Total CO2 emissions
75 GtCO2
SSP5-8.5
Avoided emissions pathways
SSP3-7.0
50
SSP4-6.0
Current policies
Historical
Conditional NDCs
2C pathway
25
1.5C pathway
0
1990
’95
’00
’05
’10
’15
’20
’25
2030
2035
Sources: SSP Public Database – International Institute for Applied Systems Analysis; Global Carbon Budget (2025) – with major processing by Our World in Data; United Nations Environment Programme Emissions Gap Report 2025; normalised to 2015 historic total CO2 emissions.